


0.png)
.jpg "Get Timeform ratings for every upcoming runner and past result, plus premium winner-finders including commentary, Flags, Pace Maps and lots more.")


 Url copied to clipboard.

Statistics is, according to Wikipedia, “the study of the collection, analysis, interpretation, presentation and organisation of data”.
You may not care much for statistics, but, if you do, then you have probably already found that even a basic grasp of the subject matter is an advantage in the data-rich environment that is horse racing and betting on horse racing.
Data on its own is of limited use. Data which has been analysed statistically, and in a careful and appropriate manner, can be a powerful thing. While the old cliché is that there are “lies, damned lies and statistics”, a rival truth is that there are “insights, profound insights and statistics”.
There are numerous books, courses and online guides about statistics, for the beginner through to the true expert, and interested readers should seek them out (some are listed at the end of this piece). But, for the complete beginner, it is necessary first to understand some of the basic terms and what their usage is intended to achieve.
This we will attempt by reference to a particular dataset to be found in horse racing: the performance of horses when wearing blinkers.

For this study the performances of all horses foaled in 2010 when racing on the Flat in Britain and Ireland as two-year-olds, three-year-olds and four-year-olds were considered. These performances were split into: horses racing without blinkers; horses racing in blinkers for the first time; and horses wearing blinkers but not for the first time.
One measure will be a horse’s actual performance against its expected performance, as reflected in a horse’s Timeform “performance” rating compared to its pre-race Timeform “master” rating (but only for races in which a numerical pre-race rating existed).
At the outset, we can ask ourselves a simple question that every statistician, however experienced or inexperienced, is likely to ask: “How should we learn from this dataset?”
To begin with, we can establish how many performances (or “cases”) there were in each category. This is the “count”. From this, we can establish what proportion falls into each category by summing the whole and expressing each category as a “percentage”, by multiplying the cases in that category by 100 and then dividing the result by the sum of the whole.
As the table below shows, many more horses were blinker-less than wore blinkers, which is a finding of sorts. But it is a finding that is of no use to anyone trying to establish if horses run better when blinkered than not.
For this, we could consider the average (or “mean”) performance against expectation in each category. The value in each of the categories in the table below is negative, but more so for blinkered horses (especially first-time blinkered horses) than not. Master ratings are what horses are considered capable of at their best: most performances fall short of that.
Regular readers might wish to recall earlier comments – from the cognitive biases and psychology of betting module – about selection bias. It is not necessarily, or even probably, the case that blinkers make horses run worse: they are applied for a reason, and that reason may be that the horse in question threatens to become, or has already become, disappointing.
You will not journey far into statistics before you encounter the phrase “correlation does not imply causation”. In this case, the fact that horses wearing blinkers have tended to run more disappointingly than those that do not (a correlation, possibly) does not prove that blinkers themselves caused that to happen.
Means or averages – dividing the sum of a category by the number of cases within it – are something most people are aware of. But averages can be poor at summarising a population, especially when that population is not “normally distributed”.
It is also worth looking at medians – the middle value of the population or category being considered – which may work better for skewed distributions (which occur quite often in horseracing, not least in time analysis), and we can also consider the “mode”, or the most common value within each category.
Medians, means and modes deal with single values which may, or may not, define something worthwhile about a population but which will say little or nothing about that population’s distribution and the variance within it.
We can look at the range of each category (what falls between the minimum and maximum values), the interquartile range of the same (the difference between the value which lies 25% into a population and the value which lies 75% into a population when that population is arranged from largest to smallest) and we can look at standard deviation.
The last-named is used to quantify the amount of variance in a set of values and is expressed as the square root of the squared deviations from the mean of the population.
For instance, the mean of the values 2, 4, 4, 4, 5, 5, 7 and 9 is 5, and the standard deviation is the square root of (9+1+1+1+0+0+4+16)/8, which is 2. The mean of the values 0, 5 and 10 is also 5 but the SD is the square root of (25+0+25)/3, which is more than 4.
There is much more variance in the second set of figures than the first, despite both sets of figures having the same mean and median (but not mode).
A summary of the figures for the “blinkers research” is as follows:
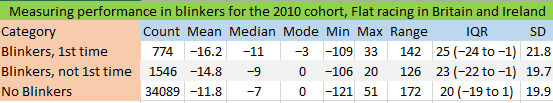
Reasonable conclusions might include: that far more horses don’t wear blinkers than do; that horses wearing blinkers tend to perform worse against expectation than do those not wearing blinkers (but not necessarily because blinkers themselves make them perform worse); that this phenomenon is more pronounced for horses wearing blinkers for the first time than other blinkered horses; but that there is more variance in performance in first-time blinkered horses than in other types.
That last point is an interesting one, and is a reason why punters may be right to pay attention to horses wearing blinkers for the first time. Such horses tend to perform worse than expectation, but the variance in their performances (for better and for worse) is greater, making generalisations less fitting.
It can be difficult to profit from “average” performances, but non-average performances, which vary more than in the wider population, may be a different matter.
Statistics is a vast subject and it would be a huge exaggeration to say that the above even scratches the surface of it. You don’t need to venture much further to come across a challenging world of significance testing and much, much more esoteric matters. But it may break the ice regarding some of the most basic terms and concepts and whet the reader’s appetite to learn more.
For further reading on the uses (and abuses) of statistics, you could do a lot worse than try the likes of “Dicing With Death” by Stephen Senn, “The Signal And The Noise” by Nate Silver, “Bad Science” by Ben Goldacre and anything by the excellent David Spiegelhalter.


_(1).jpg&w=300)

.jpg&w=300)
.jpg&w=300)


