


0.png)
.jpg "Get Timeform ratings for every upcoming runner and past result, plus premium winner-finders including commentary, Flags, Pace Maps and lots more.")


 Url copied to clipboard.

Much of what has come before in The Timeform Knowledge Series has focused on gathering information and acquiring skills, such as how to assess form and times, how to read a race, how to avoid cognitive mistakes, and how to harness statistics and probability theory.
But information and skills still require implementation, and getting that right can be every bit as challenging in its own way. Implementation is what we will now move onto, starting with “How To Price Up A Race”.
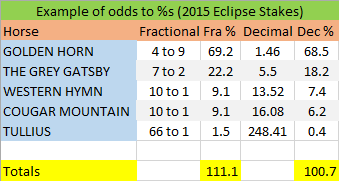
First off, a small amount of straightforward arithmetic is required in order to understand what a horse’s odds relate to in terms of its percentage chance, and vice versa, and the same with the sum of those percentages for all horses within a race.
A horse’s odds can be converted into percentages by dividing 100 by those odds plus one (if dealing in fractional odds), or by dividing 100 by those odds (if dealing in decimal odds).
So, if a horse is 5/1 in fractional odds, the calculation is 100/((5/1)+1) = 16.67%
And, if it is 2.92 in decimal odds, the calculation is 100/2.92 = 34.25%
The sum of the percentages of all horses in a race will give you the percentage for the race itself. This will be in excess of 100 in most cases.
There is a 100% chance (for these purposes) that a race will be won by one of the horses in that race. Any figure above 100 represents the margin (or “over-round”) built into the prices.
It would be possible (in theory, if not always in practice) to back every potential outcome, in proportion, and to show a profit regardless, if the percentage for a race were below 100.
The place part of each-way bets, where place odds are dictated by win odds, can sometimes be “over-broke” in this way, which is why place-only betting is not allowed, other than in place-only markets (and is also why each-way betting is so attractive to value-seekers under certain conditions).
If pricing up a race yourself, you may want to attempt a “fair-price” book, in which the horses’ individual percentages sum precisely to 100. Or you may want to build in a margin, as bookmakers would.
Rather than fiddling around with sums, it is best to create a spreadsheet to tackle the calculations for you. Timeform has done just that, with a free spreadsheet – dealing with both fractional and digital odds and win and place markets – available to be downloaded here.
The discipline of pricing up a race – of assigning those percentage likelihoods to each horse within an event – is at something of a crossroads in its long history.
It is a fair bet that when the ancestors of Ryan Moore and Ruby Walsh rode round Rome’s Circus Maximus the ancestors of William Hill and Joe Punter did not consult spreadsheets or sophisticated mathematical models before striking bets: they bet on instinct and with some sort of an appreciation of what past events – “form” – told them.
The instinctive approach to pricing up events has stood humankind – or some of it, anyway – in good stead for many centuries since, not least because assigning probabilities to protagonists in a horse race involves weighing up events which have not strictly happened before and will not strictly happen again.
Timeform uses both human intuition and algorithms to assist it in pricing up races. Even then, human intuition uses some crucial and logical rules of thumb, as members of Timeform’s Pricing Team explain:
James Cooper: “as a starting point, especially in non-handicaps, I initially try to identify the first couple in the betting and the likely proximity between the pair. If you can get that right, the shape of your tissue will not be far out.”
“There is a difference between predicting the Starting Price of each horse in a race – which is what we are attempting at Timeform – and pricing up a race purely on one’s own view of matters. The former involves reading the collective mind of the crowd, while the latter may differ by some way from this as you place greater or lesser emphasis on certain factors.”
Jim Todd: “a good tool when trying to price-up a race is to note the Starting Price for each horse’s most recent run. There is a huge amount of information implicit in that one data point, but it needs to be put into context in terms of the strength of that previous race compared to the strength of the race today, and in terms of how it performed against expectation in that earlier race.”
“A simple illustration might be that a horse which started at 10/1 in a 10-runner handicap on its most recent start and finished in mid-field was expected to run an average-sort-of race and did indeed run an average-sort-of race. If it is running in a similar handicap now, there needs to be a compelling reason to expect it to run particularly well or particularly poorly and to price it accordingly.”
“Those compelling reasons can exist – such as a horse running over a much more, or less, suitable trip or having been unlucky, or flattered, in that earlier race – and these can be layered on top of this initial assessment.”
“Another simple illustration might be that a horse which started at, say, 10/1 for a competitive Newmarket maiden (based on form, pedigree, trainer, reputation etc.) will usually start a considerably shorter price next time at somewhere like Ripon or Pontefract, almost irrespective of how it performed on that earlier start.”
Manual price compilers seem to be agreed that the process of pricing up an entire race should involve establishing provisional prices for each individual horse (perhaps focusing on two or three of the most important ones initially) and then gradually bringing those prices into line with the desired overall percentage for the race, and for the individual horses themselves, through incremental “tweaks” to those prices.
It is another area in which “practice makes perfect” (or less imperfect, anyway). Anyone wishing to price up races should, as with other disciplines, make sure they gauge how well they are doing by comparing their predicted prices to the actual ones and to results over a good number of cases.
.jpg&w=300)

_(1).jpg&w=300)

.jpg&w=300)
.jpg&w=300)


